
HR & Operations
Org Chart Mind Map Template
By RP Hobbyist · Updated
An organizational chart shows who reports to whom. It makes roles, responsibilities and lines of authority visible, which helps new hires find their way, shows managers where teams are over- or under-staffed, and supports planning for growth or restructuring.
This template is a three-level hierarchy: a CEO, three vice presidents (Engineering, Sales and Operations), and two roles under each. Rename the boxes, add or remove levels, and use colors to show departments, open positions or locations.
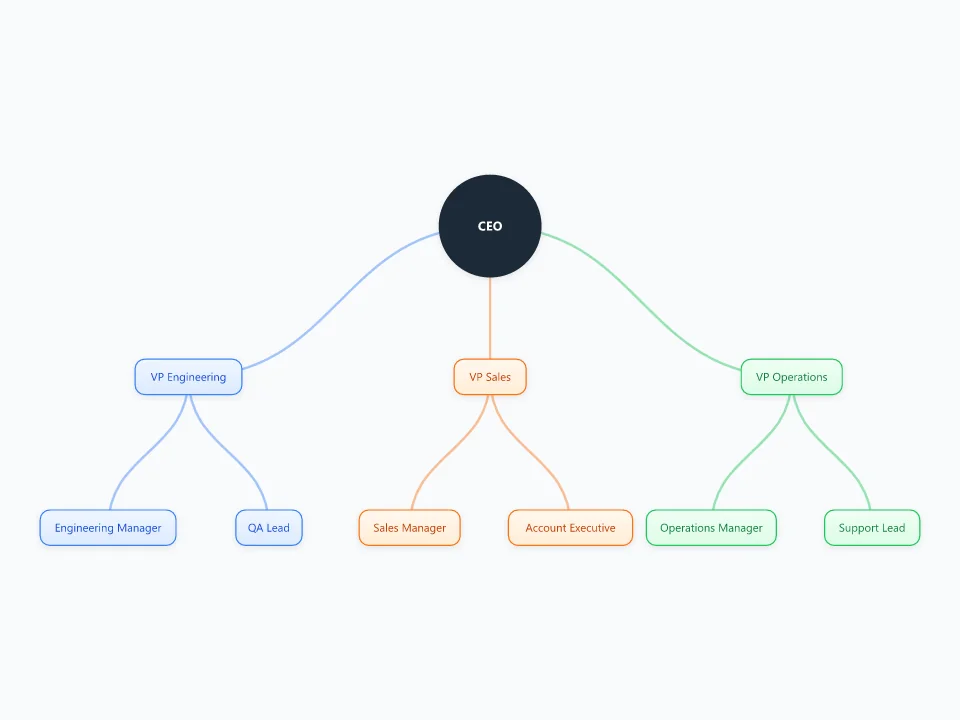
It opens as a new map with 10 topics already filled in. You don't need an account.
Open in the editorWhen to use a Org Chart
- Onboarding new employees and showing who does what
- Planning hires, reorganizations or a new team structure
- Documenting a small business or startup as it grows
- Club, school or volunteer organization structures
What goes in each branch
- CEO
- The top of the hierarchy: the person or board everyone ultimately reports to.
- VP Engineering, Sales, Operations
- Department heads. Rename them to match your own functions, such as Marketing, Finance or Product.
- Managers and leads
- Team-level roles under each department. Add people's names as child nodes, or mark open positions in a different color.
Example: A 15-person hardware startup
- CEO: the founder
- VP Engineering: firmware lead, mechanical lead, QA
- VP Sales: account executive, marketplace manager
- VP Operations: production manager, support lead, and an open logistics coordinator role
Tips
- Show roles first and add names as child nodes, so the chart survives staff changes.
- Use one color per department and a distinct color for open positions.
- Include only the levels your audience needs, and make separate maps for large departments.
- Add responsibilities or contact details to each role's notes for an onboarding-ready chart.
Using this template in Neuron Mapping
- Click Open in the editor. The template opens as a new map.
- Select a topic and press Tab to add a branch under it, or double-click a topic to change its text.
- Select a topic to change its color and shape, or add notes to it in Markdown.
- When you're done, export the map as a PDF or PNG, or save it to keep editing later.
Everything runs locally in your browser: your map is saved on your device, works offline, and can be exported as PDF, PNG or an editable .nmm file.