
Planning & Strategy
Technology Stack Layer Diagram Template
By RP Hobbyist · Updated
A layer diagram shows a system as a stack, where each layer depends only on the layers below it. It's the quickest way to explain how a piece of software is put together, and to point at where a new feature or a problem sits.
This template stacks four layers under a Technology Stack node: Presentation Layer, API Gateway, Business Logic and Data Layer. The nodes use the isometric shape, so in the editor the map looks like a stack of blocks. Add child nodes to each layer for the frameworks, services and databases it contains.
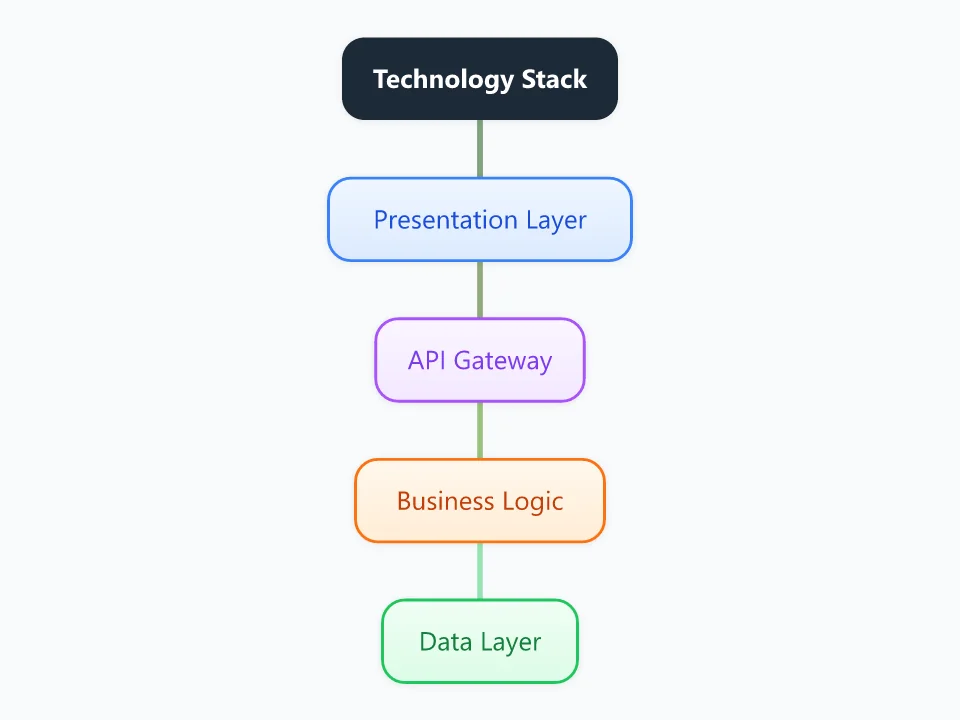
It opens as a new map with 5 topics already filled in. You don't need an account.
Open in the editorWhen to use a Layer Stacking Layout
- Explaining a system's architecture to new developers
- Writing architecture docs or a design proposal
- Planning a migration, such as moving one layer to a new technology
- Teaching layered architecture in a software course
What goes in each branch
- Presentation Layer
- What users see and use: web apps, mobile apps, admin dashboards.
- API Gateway
- The single entry point for requests, handling routing, authentication and rate limits.
- Business Logic
- The rules of the application, often split into services such as orders, billing or search.
- Data Layer
- Databases, caches, file storage and search indexes, along with what each one holds.
Example: An online booking system for a chain of gyms
- Presentation: a React website, iOS and Android apps, and a dashboard for staff.
- API gateway: a managed gateway that handles logins and rate limits.
- Business logic: separate services for class schedules, bookings and payments.
- Data: PostgreSQL for bookings, Redis for live class availability, and object storage for trainer photos.
Tips
- Describe what each layer does in the layer node, and put tool names in its child nodes.
- Color the parts that change in a migration so the scope is obvious.
- Add a side branch for things that cut across every layer, like logging, monitoring and security.
- Keep the diagram up to date. An out-of-date architecture diagram misleads people more than having none.
Using this template in Neuron Mapping
- Click Open in the editor. The template opens as a new map.
- Select a topic and press Tab to add a branch under it, or double-click a topic to change its text.
- Select a topic to change its color and shape, or add notes to it in Markdown.
- When you're done, export the map as a PDF or PNG, or save it to keep editing later.
Everything runs locally in your browser: your map is saved on your device, works offline, and can be exported as PDF, PNG or an editable .nmm file.