
Business
Business Model Canvas Mind Map Template
By RP Hobbyist · Updated
The Business Model Canvas, created by Alexander Osterwalder, describes how an organization creates, delivers and captures value using nine building blocks: customer segments, value propositions, channels, customer relationships, revenue streams, key resources, key activities, key partners and cost structure. It fits a whole business model on one page, which makes it a favorite for startups, product teams and innovation workshops.
This template lays out all nine blocks as branches of a single map. Start with the customer side (segments, value propositions, channels, relationships, revenue), then fill in the infrastructure side (activities, resources, partners, costs) that makes it possible.
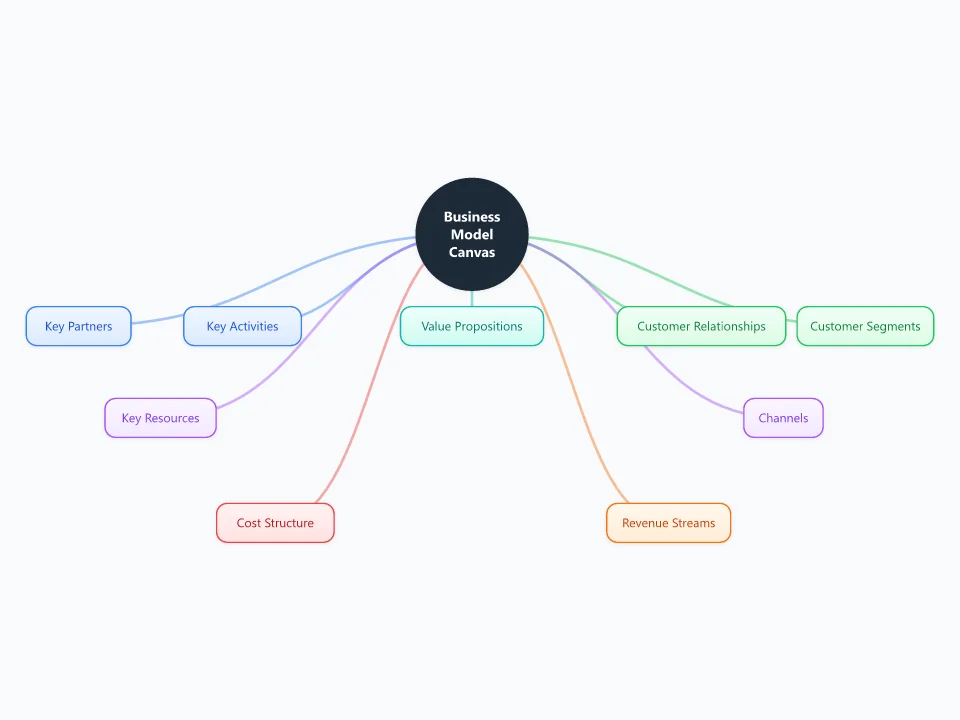
It opens as a new map with 10 topics already filled in. You don't need an account.
Open in the editorWhen to use a Business Model Canvas
- Sketching a new startup or side-business idea
- Documenting how an existing business actually makes money
- Comparing alternative business models before choosing one
- Preparing for a pitch or investor conversation
What goes in each branch
- Customer Segments
- The distinct groups you serve. Be specific: "freelance designers", not "everyone".
- Value Propositions
- The problem you solve or the gain you create for each segment, and why they would choose you.
- Channels
- How customers discover, buy and receive what you offer: website, marketplace, retail, a sales team.
- Customer Relationships
- The relationship each segment expects: self-service, community, personal support, subscription.
- Revenue Streams
- How each segment pays: one-off sales, subscriptions, licensing, usage fees, advertising.
- Key Resources
- The assets the model depends on: people, intellectual property, equipment, data, brand.
- Key Activities
- What you must do well to deliver the value proposition: production, platform development, problem solving.
- Key Partners
- Suppliers and partners who provide resources or activities you don't do yourself.
- Cost Structure
- The most important costs of running the model, and whether it is cost-driven or value-driven.
Example: An open-source desktop app funded by donations and paid support
- Customer Segments: individual makers; small teams that need support
- Value Propositions: a free, private, offline tool; guaranteed response times for teams
- Revenue Streams: donations, sponsorships, annual support contracts
- Cost Structure: developer time, code-signing certificates, download hosting
Tips
- Fill the customer side first; the infrastructure only makes sense once you know who you serve and why.
- Give each customer segment its own color and reuse it in the other blocks to see which activities and costs serve which customers.
- Treat every note as a hypothesis to test, not a fact, especially for a new venture.
- Keep a copy of each version. Comparing canvases side by side shows how your model evolved.
Using this template in Neuron Mapping
- Click Open in the editor. The template opens as a new map.
- Select a topic and press Tab to add a branch under it, or double-click a topic to change its text.
- Select a topic to change its color and shape, or add notes to it in Markdown.
- When you're done, export the map as a PDF or PNG, or save it to keep editing later.
Everything runs locally in your browser: your map is saved on your device, works offline, and can be exported as PDF, PNG or an editable .nmm file.