
Planning & Strategy
Fishbone Diagram (Cause & Effect) Template
By RP Hobbyist · Updated
A fishbone diagram, also called an Ishikawa or cause-and-effect diagram, is a root cause analysis tool developed by Kaoru Ishikawa for quality management. The problem sits at the head of the fish, and the bones are categories of possible causes. Working through each category stops a team from jumping to the first explanation and helps it see every factor that could contribute.
This template starts with six common cause categories, Equipment, Materials, Process, Environment, People and Management, connected to a central problem. Rename or add categories to suit your field, then brainstorm specific causes under each one.
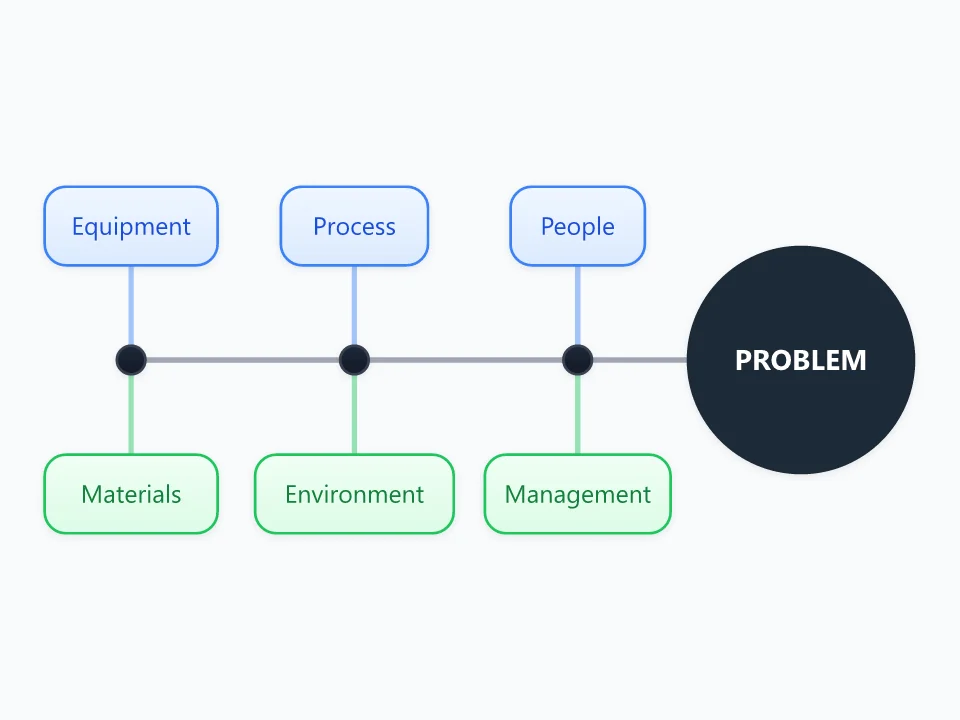
It opens as a new map with 10 topics already filled in. You don't need an account.
Open in the editorWhen to use a Cause & Effect
- A recurring defect, failure or complaint with no obvious cause
- Structured team brainstorming in a quality or incident review
- Investigating a production, service or software problem
- Choosing which likely cause to dig into with a 5 Whys analysis
What goes in each branch
- Equipment
- Machines, tools, hardware and software: calibration, wear, configuration, capacity.
- Materials
- Raw materials, parts, data or other inputs: quality, specifications, supplier variation.
- Process
- The method used: unclear procedures, missing steps, handoffs, steps done in the wrong order.
- Environment
- Conditions around the work: temperature, humidity, noise, workspace layout, time pressure.
- People
- Skills, training, workload, communication and staffing.
- Management
- Policies, targets, resourcing, supervision and decisions that shape the work.
Example: 3D prints failing with warped corners
- Equipment: uneven print bed; worn nozzle
- Materials: damp filament; a new filament brand
- Process: first-layer settings changed last week
- Environment: cold draft near the printer
- People: new operator not yet trained on bed leveling
Tips
- State the problem as something specific and measurable ("12% of parts warp"), not something vague.
- List possible causes first and judge them later; the value is in the breadth of the brainstorm.
- Mark causes you can verify with data in a different color, and test those first.
- Take the strongest candidate cause into a 5 Whys analysis to find its root.
Using this template in Neuron Mapping
- Click Open in the editor. The template opens as a new map.
- Select a topic and press Tab to add a branch under it, or double-click a topic to change its text.
- Select a topic to change its color and shape, or add notes to it in Markdown.
- When you're done, export the map as a PDF or PNG, or save it to keep editing later.
Everything runs locally in your browser: your map is saved on your device, works offline, and can be exported as PDF, PNG or an editable .nmm file.